
Article review: The training intensity distribution of marathon runners across performance levels
Background
Any coach or athlete pursuing the marathon wants to know: how should I train to get the most out of my preparation and run the best time possible? Traditionally, these answers have come from anecdote or controlled lab-based studies. However, Muniz-Pumares et al. (2025) took a different approach. Rather than studying a small cohort under controlled conditions, they analyzed large-scale real-world training data to examine how actual marathoners train. They did this by pulling training data from Strava, ultimately analyzing 151,813 marathons completed by 119,452 runners. Runners were categorized by finish time in 30-minute buckets — 120–150 minutes, 150–180 minutes, 180–210 minutes, and so on — and training characteristics were examined to determine which variables predicted better or worse performance.
Methods
To organize results by intensity, the researchers used a three-zone model detailed in the table below:
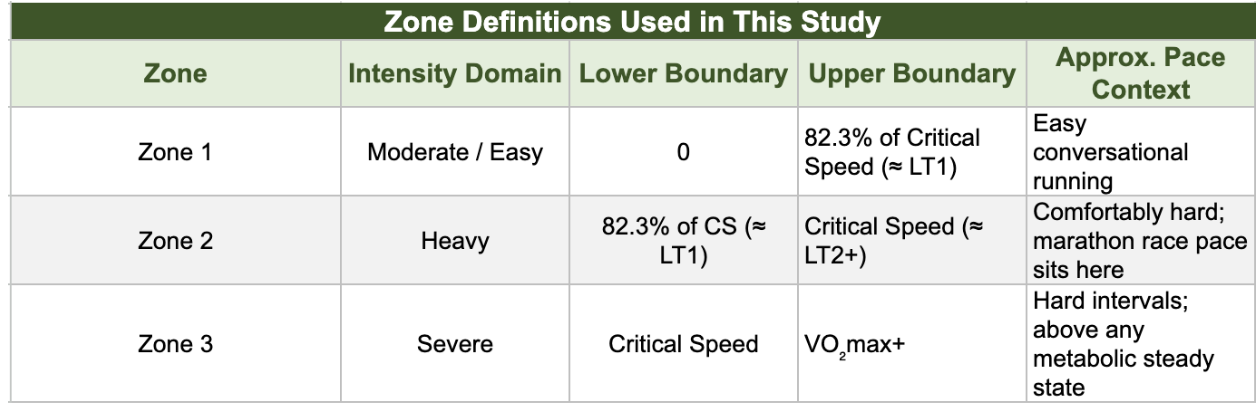
The training zones were determined by analyzing each runner's best performances across distances ranging from 400m to 5,000m recorded on Strava. Previous research has validated this as a reliable method for estimating critical speed (CS). The boundary between Zone 1 and Zone 2 was set at 82.3% of CS, which approximates the first lactate threshold (LT1). The boundary between Zone 2 and Zone 3 was set at critical speed itself, which sits close to LT2 — the intensity above which a metabolic steady state can no longer be maintained and cumulative fatigue becomes inevitable. This is a well-established and practical way to partition training intensity, and one that many coaches and athletes already use.
The researchers also defined four training intensity distributions (TID), shown in the table below:
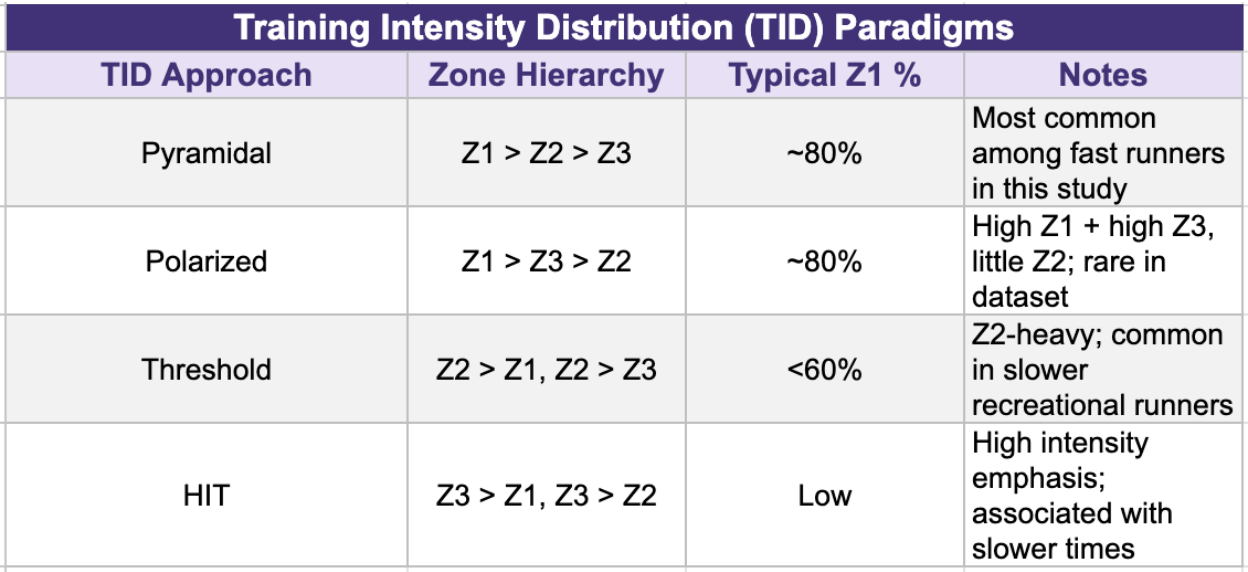
These are commonly used training intensity distributions used by runners and coaches in the real world. Historically, runners have trained using the polarized and pyramidal models. More recently, there has been a buzz around threshold training with the rise of elite runners out of Norway. HIIT, though always a popular option for improving health and longevity, tends to be used sparingly by marathoners, as it is not a specific type of training for the marathon and longer distance events. Keep in mind, this is not specific workouts, but intensity training distributions. Think of it, as indicated above, by what zone of training is most dominant throughout a training plan.
Results
I used Claude, Anthropic's AI assistant, to organize and summarize the study data into all the tables seen in this blog. Where data was presented graphically in the paper rather than as explicit numbers, Claude estimated values from the figures. These estimates are approximate but specific enough to illustrate the key findings and make them practical for the reader.
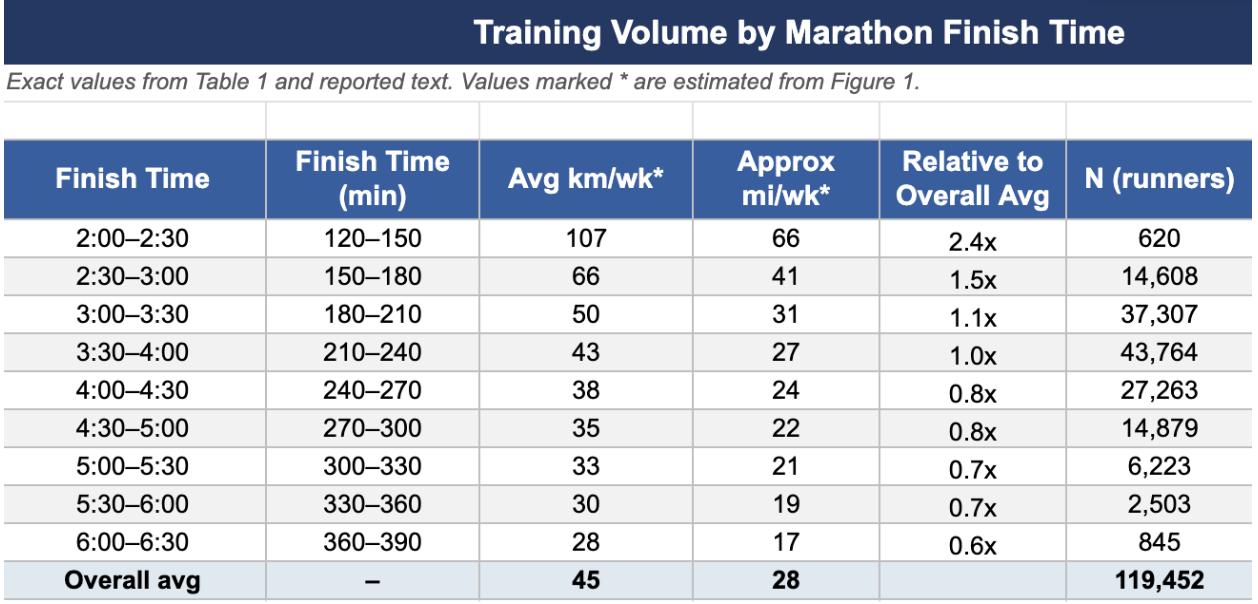
This table shows the relationship between average weekly mileage and marathon finish time. The pattern is clear: higher weekly training volume was associated with faster finish times across the board. This held true for both male and female runners.
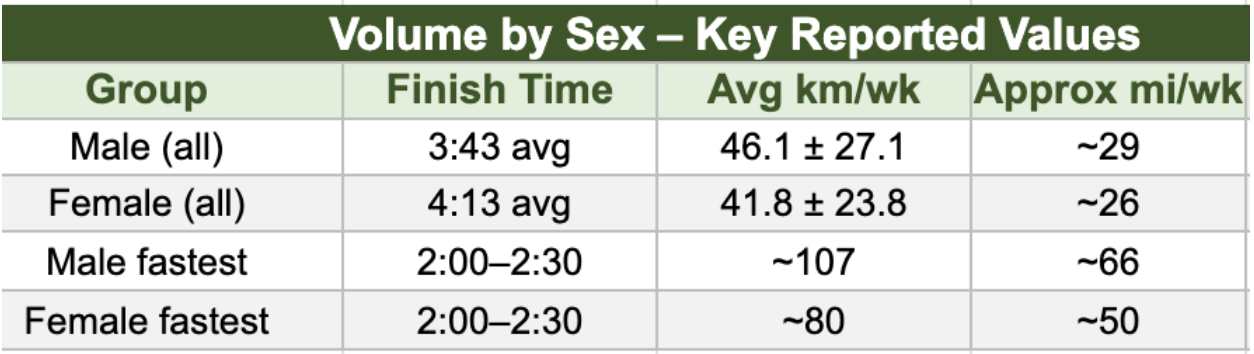
This table reinforces the volume finding and compares weekly mileage in the fastest performance tier against overall averages by sex. Again, the relationship between higher average weekly mileage and faster finish times is evident.
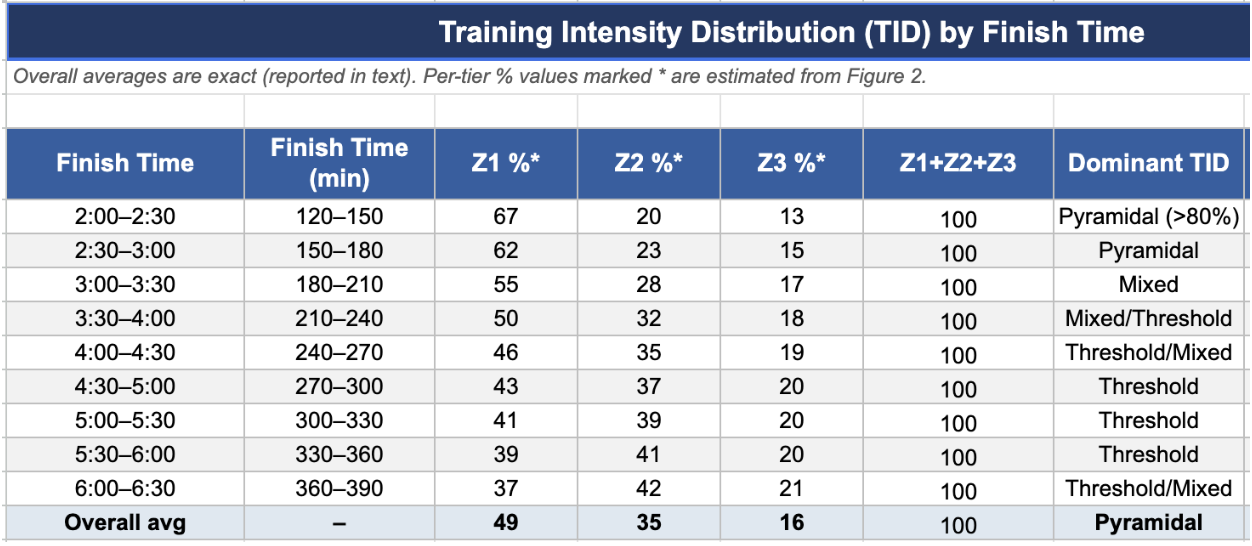
This table shifts the focus from volume to intensity. As finish times improved, a progressively larger share of training time was spent in Zone 1, with less time in Zones 2 and 3 — a pyramidal distribution. There was a positive relationship between the percentage of training completed in Zone 1 and faster finish times, and a negative relationship between Zone 3 training and performance.
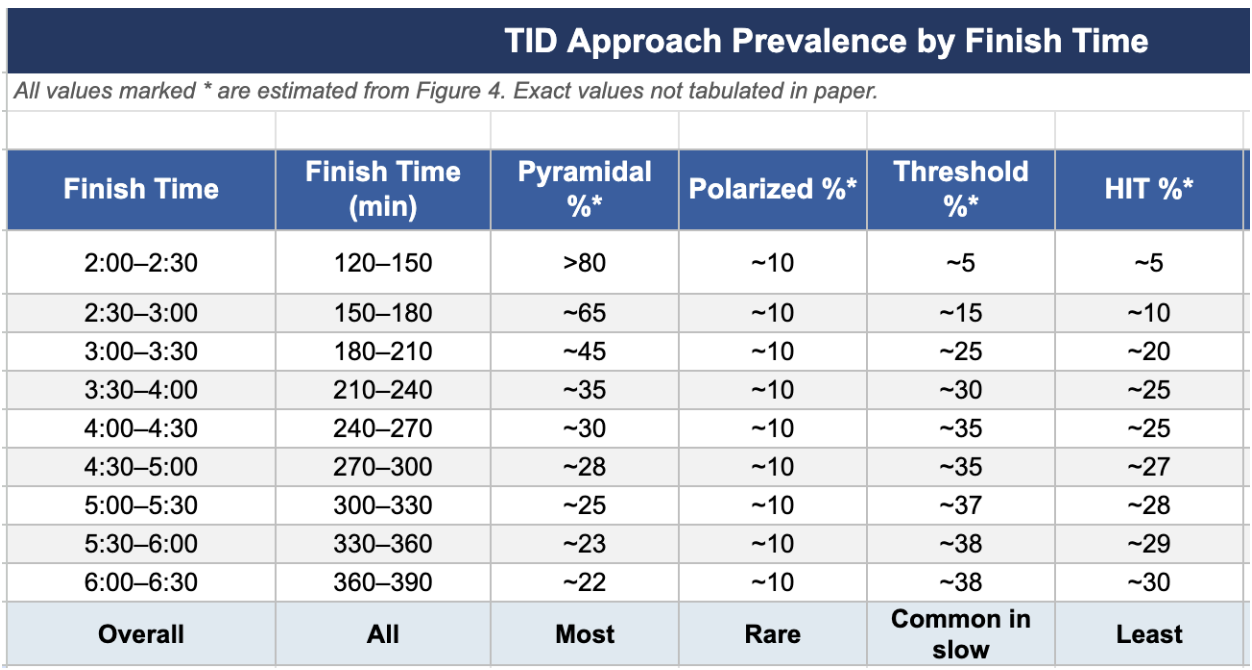
This table shows what percentage of runners in each finish-time cohort adopted a pyramidal, polarized, threshold, or HIIT training approach. The faster the finish time, the greater the proportion of runners training pyramidally (Z1 > Z2 > Z3). Conversely, the slowest groups had the highest proportion of runners following a threshold (Z2 > Z1 > Z3) or HIIT (Z3 > Z1 > Z2) approach, and the lowest proportion training pyramidally.
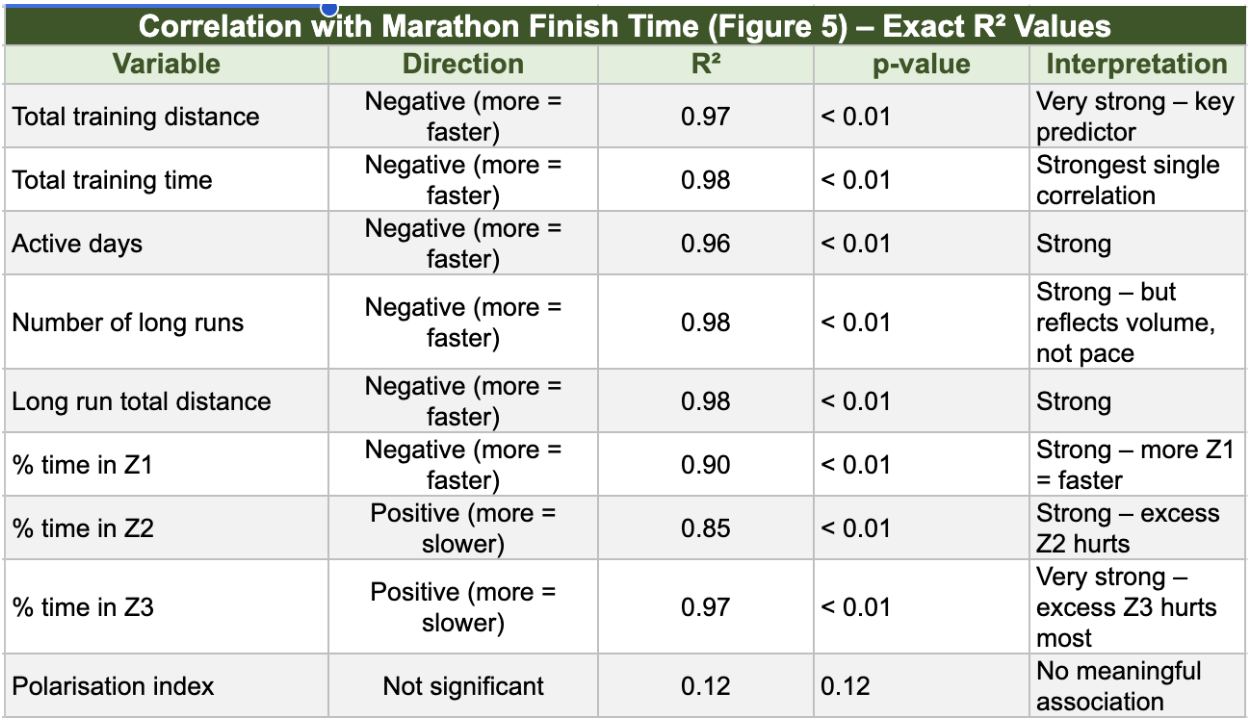
This final table summarizes the relationship between various training variables and finish time. R² values close to 1.0 and p-values below 0.05 give us greater confidence that a given variable meaningfully predicts performance. Higher training volume across all measures — total distance, total time, active days, number of long runs, and long run distance — showed strong to very strong associations with faster finish times. In terms of intensity, a greater proportion of training in Zone 1 predicted faster times, while greater proportions in Zones 2 and 3 predicted slower times.
What should runners and coaches take from this?
First, it's worth acknowledging what this study is and isn't. This is not a randomized controlled trial. It is a window into how real runners actually train. I'd argue that's precisely what makes it valuable. Controlled lab studies and large observational datasets like this one each tell us something different, and both deserve a place in how we think about training.
The key takeaway is this: when selecting or designing a training program, the two non-negotiables should be 1) as much weekly volume as you can currently handle safely, and 2) the large majority of that volume should be easy. Those two principles are not separate, they're deeply connected. Easy running is what makes high volume sustainable.
This study also gives us rough mileage benchmarks worth keeping in mind, with the obvious caveat that any target needs to be individualized. For example, a 25-year-old male runner with Boston Qualifier ambitions should probably be working toward an average of 50-60+ miles per week. Runners finishing under three hours in this dataset were consistently sitting in that range. Keep in mind these are average weekly figures — peak weeks during training were likely meaningfully higher.
Want to see how I apply this kind of evidence to real training programs? Check out our training plans and let me know what you think.